Stop Sharing Static Diagrams: Interactive Architecture Diagrams with FlowDocu
Go beyond boxes and arrows. Explore live FlowDocu examples with documentation, ownership, dependencies, and reference links built into every component.
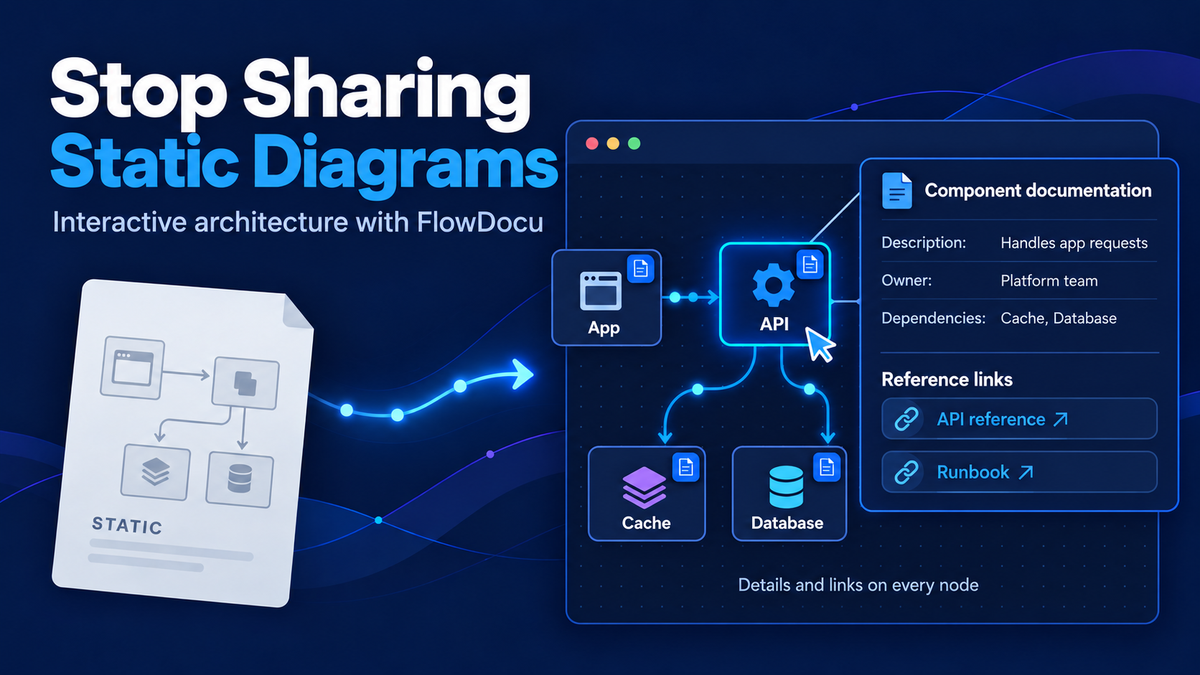
Every team has that one architecture diagram. Someone made it in a slide deck two years ago, it lives as a PNG in a wiki page, and nobody is quite sure whether it still matches production. When a new engineer asks "what happens when the cache misses?", the diagram can't answer. It's just a picture.
That's the problem I built FlowDocu to solve. It turns diagrams into interactive architecture diagrams: the arrows show which way data moves, you can play the flow step by step, and every box carries its own documentation. Below are three real flows built in FlowDocu. Each one is live, so hover over a box, click it, or press play.
The context a static diagram leaves out
Most architecture diagrams show boxes and arrows, but a lot of useful context is usually missing:
- What does this component actually do?
- Who owns it?
- What do the API request/response payloads look like?
- What are its upstream and downstream dependencies?
- How does data flow through the system?
- Where can I find related documentation or resources?
FlowDocu puts each of these answers on the diagram itself:
| The missing question | Where FlowDocu answers it |
|---|---|
| What does it do? | A description on every component, shown when you hover over it |
| Who owns it? | An Owner field, shown in the hover popup and the side panel |
| What do the payloads look like? | API documentation: endpoints, input arguments, request/response examples, error codes, plus a Try It tab |
| What does it depend on? | Upstream and downstream dependencies listed on each component |
| How does data flow? | Animated arrows for direction, plus step-by-step playback with captions |
| Where are the docs? | Reference links on every component, one click away |
The three flows below show all of this in practice.
Flow 1: Data Lake vs Warehouse vs Mesh vs Lakehouse
Let's start with a question every data team argues about: how do these four architectures actually differ?
Each architecture gets its own color-coded lane, and data visibly flows from sources to consumers:
- Data Lake: all data types land raw in object storage, and structure is applied when the data is read.
- Data Warehouse: structured data is cleaned and modeled before loading, so dashboards share one version of the truth.
- Data Mesh: the Sales, Marketing and Finance domains each own their data and publish it as products through a shared platform.
- Data Lakehouse: lake storage plus warehouse reliability (ACID tables via formats like Delta Lake and Apache Iceberg), so one copy serves both BI and ML.
The source cards gently "pop" in turn to show where each journey starts, and a callout at the bottom sums up the key difference in two sentences. Hover over a card to see what it does. Click it for practical notes: typical tools, when to use it, and the gotchas, with links to primary sources like Zhamak Dehghani's data mesh principles and the original Lakehouse paper. Each lane also has its own playback scenario, so you can walk through how data flows in one architecture at a time.
Flow 2: System diagram and API flow
The second flow is a classic system diagram: a user signs into a mobile app, the app calls a backend API, and the API checks a Redis cache before falling back to the main datastore.
It looks like a simple four-box diagram until you click a component. The API Endpoint opens into real API documentation:
- environments (production and staging URLs)
- the auth method
- each endpoint with its input arguments
- request and response payload examples for success and failure cases ("Success", "Missing/expired token")
There's even a Try It tab that runs a mock request against the documented examples. Each component also lists who owns it and its upstream and downstream dependencies: the API knows it's called by the mobile app and reads from Redis. The Redis Cache node covers cache hits versus misses and links to its docs.
Press play and the flow walks through the request step by step, with a caption on each arrow: "The mobile app sends an authenticated GET /v1/data request with the user's bearer token attached." That's onboarding material for a new engineer, and it's the same diagram as the architecture view.
Flow 3: What is OpenRouter? Comparing two paths side by side
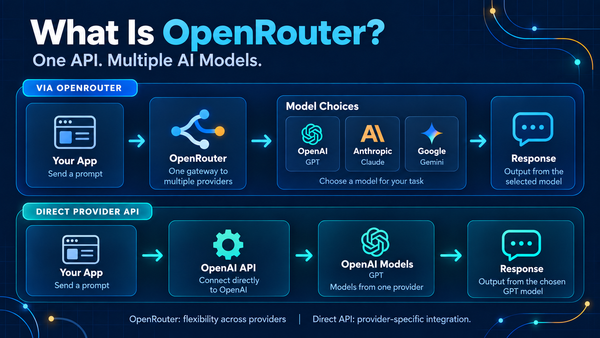
The third flow is an explainer. It compares calling AI models through OpenRouter (one API in front of many model providers) with calling a single provider's API directly.
This one shows a different side of FlowDocu:
- Lanes and cards. Two colored lanes, each a simple left-to-right path, built from card shapes with icons, titles and subtitles.
- Animated arrows that show the direction requests travel.
- Multiple scenarios. Press play on "Via OpenRouter", "Direct Provider API", or "Provider Fallback". The fallback scenario highlights a provider error in red, then shows the request being retried on a second model.
- Documentation on every card. The OpenRouter card documents the actual endpoint, auth headers, request and response examples, key parameters (like fallback models and provider routing), error codes and pricing notes, each linked to the official docs.
What makes these diagrams interactive
All three flows use the same FlowDocu features:
- Documentation built into every component. Descriptions, owners, API endpoints, request/response examples, dependencies, failure behavior and reference links all live on the box they describe.
- Step-by-step playback. Scenarios with captions turn a diagram into a guided walkthrough, including failure paths.
- Animated data flow. Arrows show direction, not just connection.
- Hover details. Readers see a component's description and owner without leaving the diagram.
- Embed anywhere. Embed a live, read-only diagram in a blog, a docs site or Confluence, and limit which sites can show it.
- Templates to start from. Begin from a ready-made layout instead of a blank canvas.
- Export when you need a file. Download PNG, SVG or an animated GIF for slides.
Because the embeds are live, fixing a diagram in FlowDocu updates it everywhere it's embedded. There are no stale screenshots to hunt down.
Try it yourself
Static diagrams answer "what's in the system?". Interactive architecture diagrams also answer what each part does, who owns it, what it depends on, and how data moves through it, and they stay current wherever they're shared.
You can start a flow in FlowDocu without creating an account. Begin from one of the templates above or from a blank canvas.
What's the one diagram on your team that everyone screenshots? That's a good first candidate.